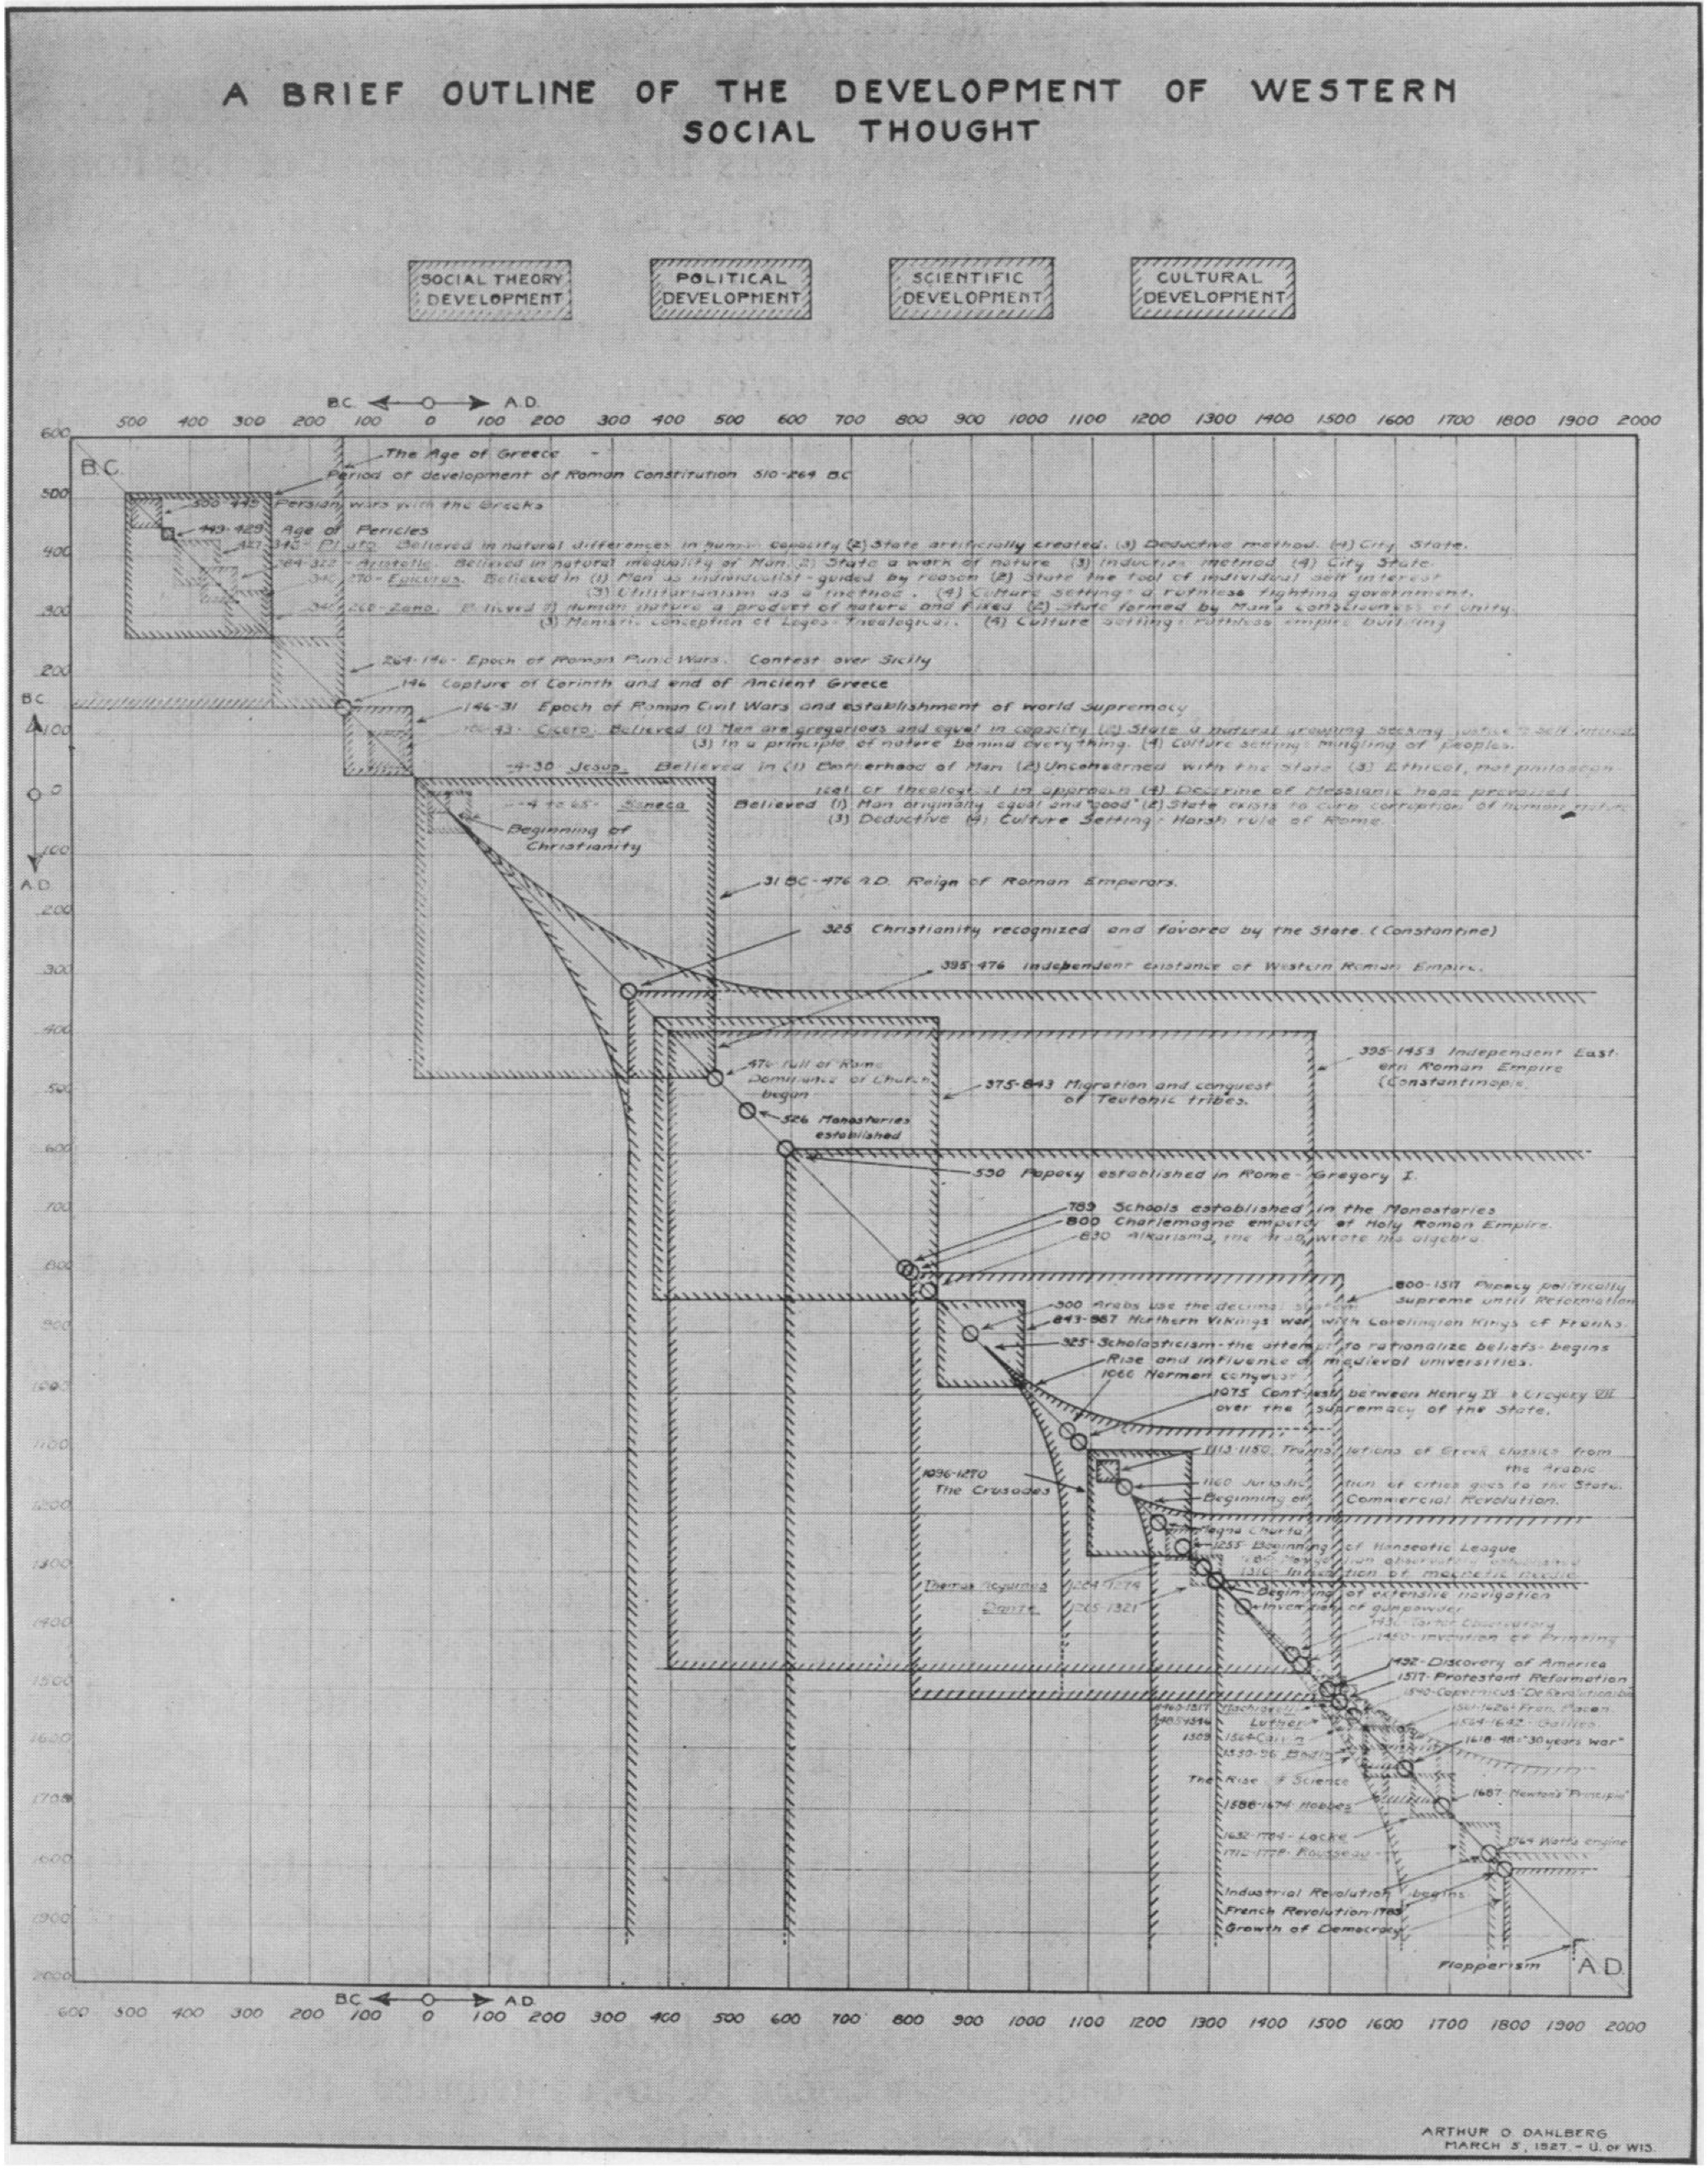
This image offers a schematic of Western history with a two-axis timeline that brings attention more effectively to long periods. It was published in the journal Social Forces in 1927.
Its author Arthur Dahlberg was a science popularizer and Technocrat active through the 20’s and 30’s. His books, which presented economic systems as closed plumbing systems and other visual metaphors, brought technocratic ideas to many important thinkers in the first half of the 20th century, making him the route by which Technocratic ideas influenced the science of complex systems. Technocracy was a social movement and economic theory that can best be glossed as capitalism under a planned economy. It was popular among farmers and other rural Americans, but was ridiculed otherwise. Nevertheless, its popularity brought it to the attention of people like Herbert Simon, who made fundamental contributions to organization theory, cognitive science, and economics, and Donella Meadows, whose own stocks-and-flows theories of economic system successfully forecasted today’s population growth and global climate change in the 1970s. His influence on original thinkers in the second half of the last century is what piqued my interest in him, and led me to this fun illustration of the state of the art of information visualization in the 1920’s. I love how it all leads to “Flapperism”, which we’ll guess he takes to mean some kind of societal fizzling over.


